Introduction
The Johan Cruyff Foundation, founded by legendary football player Johan Cruyff, is regarded as the foremost authority on sports for children and related social projects. In 2020, VB Risk Advisory started its strategic partnership with the Cruyff Foundation.
To gain insight into what the construction of a Cruyff Court means for a neighbourhood and its community and organisations, research was conducted in areas where Cruyff Courts have been constructed by USBO, a partner of the Cruyff Foundation. The main goal of our partnership is to provide the Cruyff Foundation with more insight into the impact and performance of the Cruyff Courts in the Netherlands by applying quantitative methods. We do so for the regular Cruyff Courts and the Special Cruyff Courts, which are Cruyff Courts for children with a disability, adapted to the children’s needs. Hence, they have the same opportunities to participate and be active.
This article will explain how we allow for comparisons over time, show some visual insights currently found on the dashboard, and present future steps to be taken.
Approach
As mentioned above, the main goal is to get more insight into the performance and impact of the Cruyff Courts. Each year a survey with questions about the courts is sent to the municipalities by USBO. Our dashboard makes it easier for the user to analyse the outcomes.
The idea behind the analysis is that we can compare data over the years to track the impact of the courts. The questions of the survey were subdivided into the following categories:
- Movability
- Social Cohesion
- Bridging and Bonding
- Liveability
We use these for our analyses. Each Cruyff Court is scored in each category based on the survey answers. These are called z-scores; we use those to track the changes over the years.
Insights From the Dashboard
Many insights can be derived from the dashboard, with numerous visualisations. Below are some examples.
Interactive Map
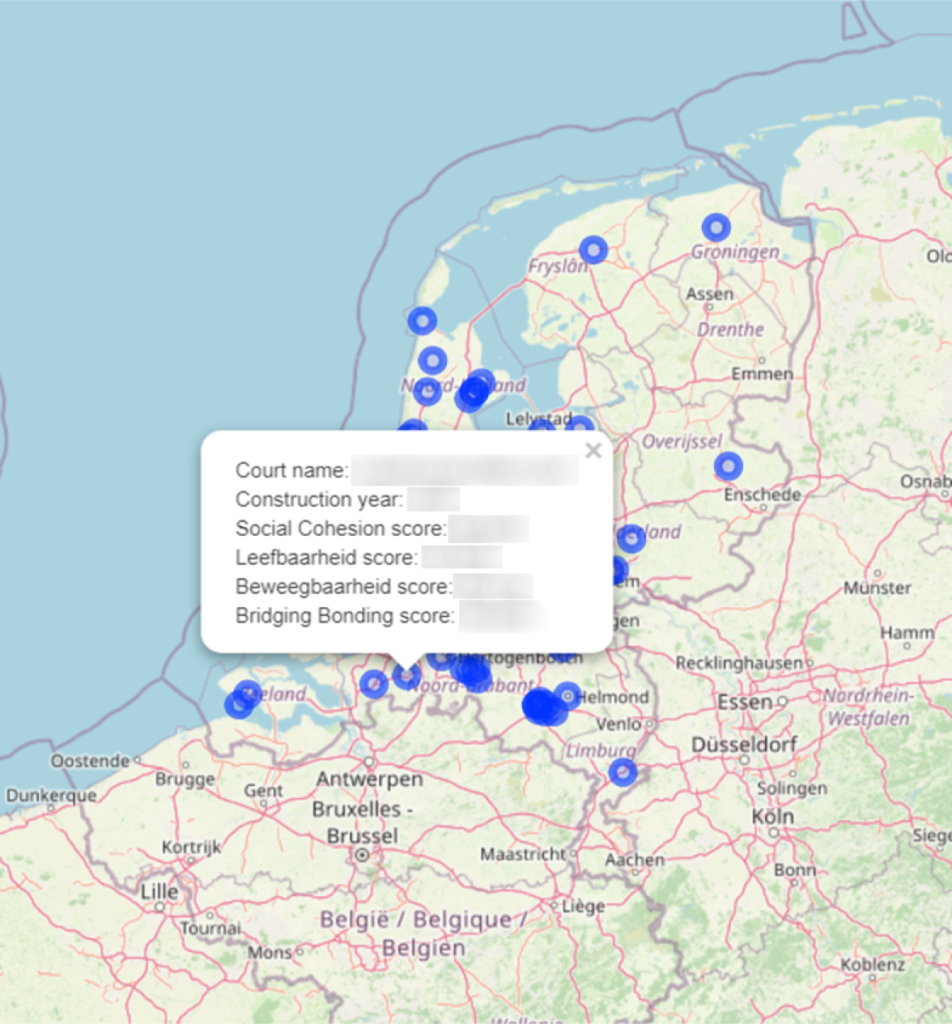
The interactive map shows all the courts that were included in the analysis. Clicking a specific
court shows a popup with relevant information and scores for that Court.
Distribution
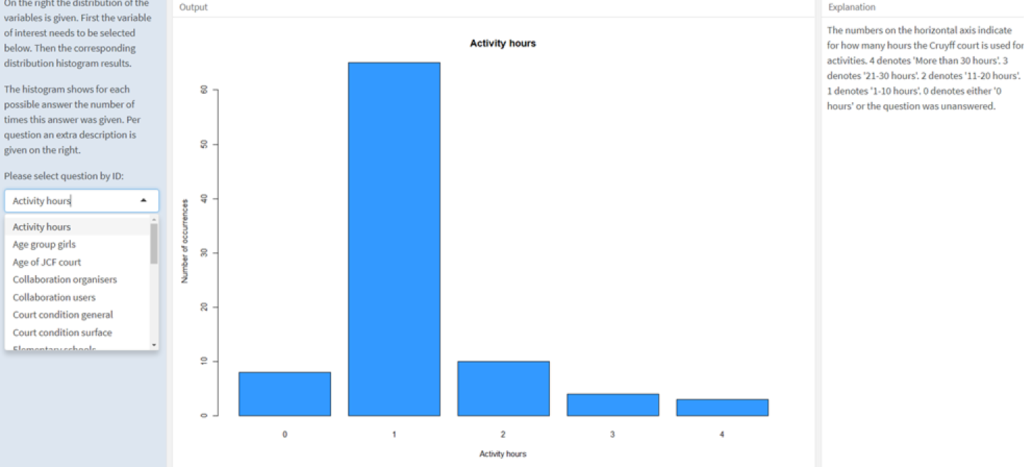
This page shows the distribution of the results for each question. This allows a more thorough
analysis per question.
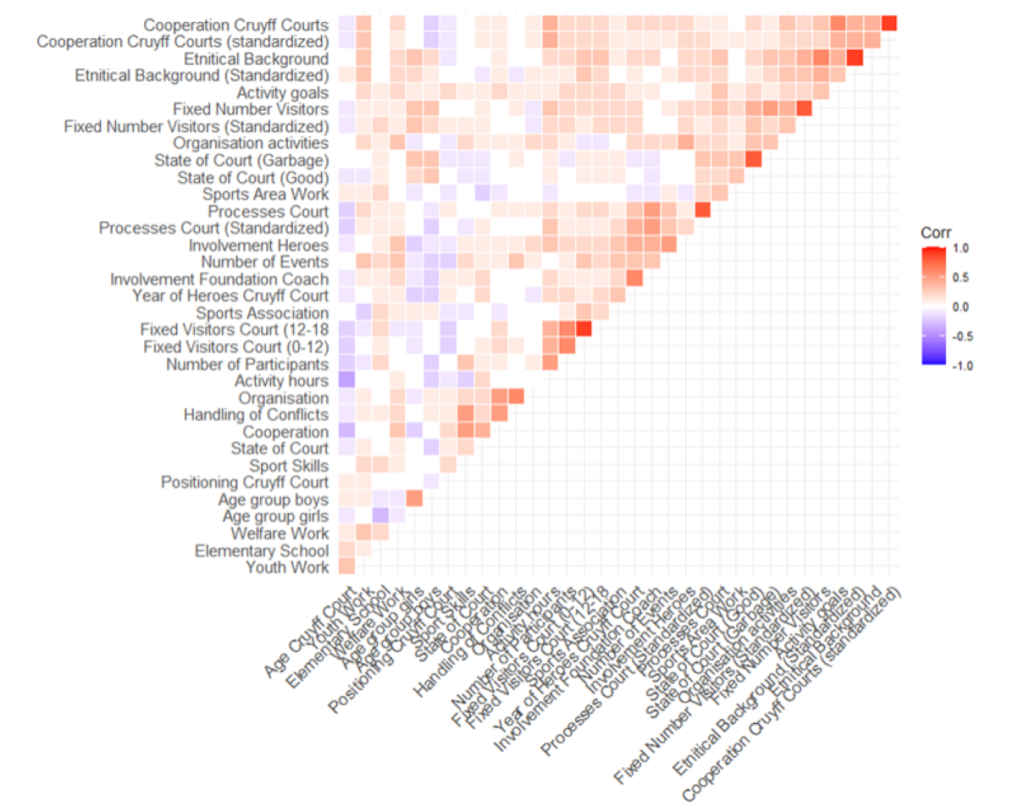
Correlation Analysis
Correlation analysis evaluates the strength of the relationship between two quantitative variables. To reduce the dimension (number of questions), we removed a question if it had a high correlation to another question.
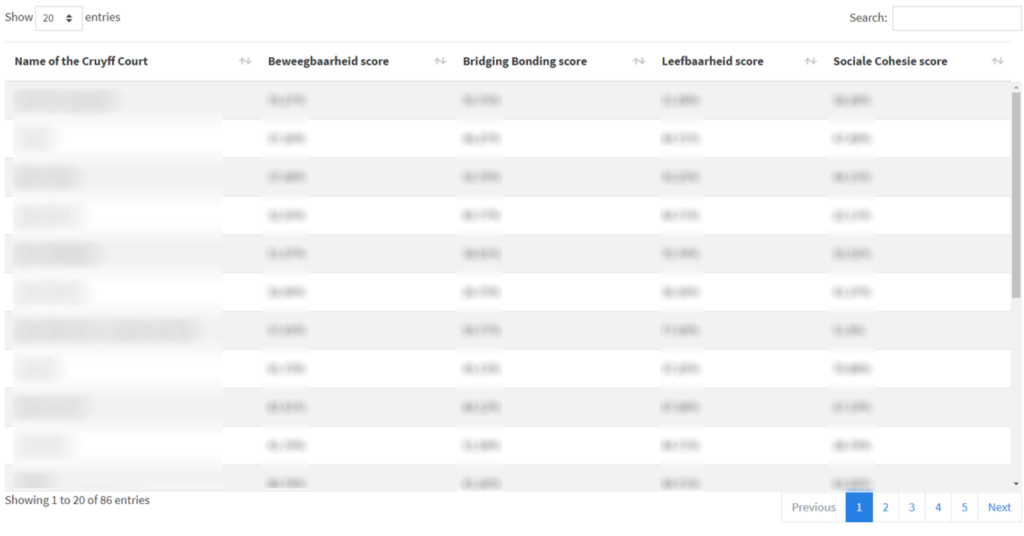
Total Overview of Scores
The table below is an example of an overview of the four scores for all courts in a table that allows the user to look up scores at a glance.
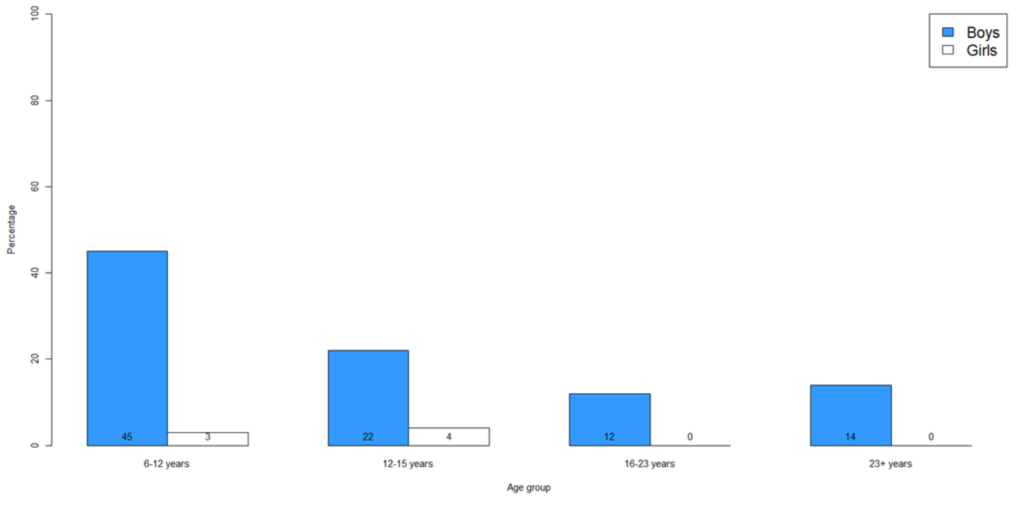
Gender and Age Distribution
This page focuses on participants’ age/gender distribution for Cruyff Courts and Special Cruyff Courts. The numbers are all percentages, so in this example, we can see that the largest group of users are 6–12-year-old boys (45%).
Future Improvements
The analysis explained above was based on the data from 2020. Moreover, the next step is to develop more comparison possibilities between and over the years. It will be valuable to see the development of all the (Special) Cruyff Courts over the years and determine what areas need improvement.
Another development is that the Cruyff Foundation and their partner USBO have developed a Theory of Change. This theory helps the Cruyff Foundation to focus on its mission of creating space for children.
The theory contains four categories:
- Liveability
- Personal development
- Well-being
- Social Cohesion
Conclusion
The Cruyff Foundation just celebrated 25 years of creating space. We are glad to help them materialise and visualise the impact of their courts these past few years and will gladly continue to do so for years to come. If you need a similar dashboard, please get in touch with us.