Introduction
Criminality among children is a problem in many cities. Even though it is a widespread problem, it is often hard to find effective prevention methods. One of the reasons is that it is often unclear what the exact problem is and why it occurs. That is crucial to know how to take adequate measures.
For the past two years, VB Risk Advisory and the city of Eindhoven have been collaborating on an interactive R Shiny dashboard to get more insight into the current situation in Eindhoven and to find the causes of the current situation.
The main goal of this dashboard is to answer the following questions:
- What are indicators for criminality amongst children?
- Are these indicators found more in specific neighbourhoods?
- What share of crimes is committed by children living outside of Eindhoven?
- What share of crimes is committed by children in their own neighbourhoods?
- Which types of crime do children most frequently commit?
- Can specific types of crime be related to certain neighbourhoods?
Our dashboard allows us to create a customised overview to obtain answers to the questions above and more.
Indicators and Risk-Factors
An essential resource for our analysis is the Zicht op Ondermijning dashboard. The most helpful topic is the information on drug criminality in all municipalities in the Netherlands. The 2018 version of this dashboard uses ten indicators or risk factors. We can look at the risk model results used in the analysis. This risk model determines the number of ‘high-risk’ children in each neighbourhood. These children are potentially more likely to become suspects in a drug crime. The model also provides the ten most explanative indicators when determining this number.
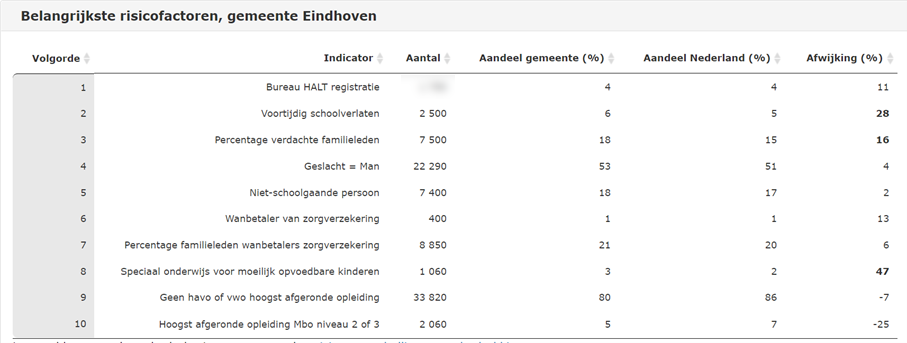
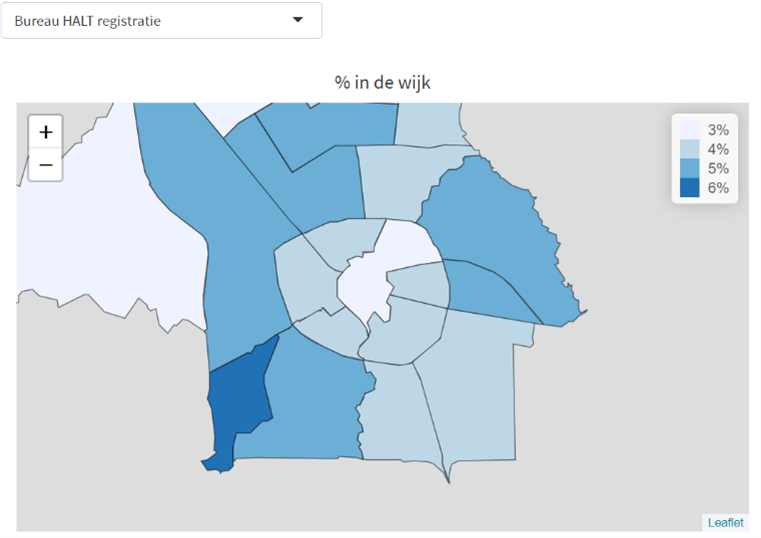
The table above can also be generated for all districts and neighbourhoods in the municipality. Combining all data, we can compare the frequency of each indicator in Eindhoven. The map below displays the frequency expressed in percentages for the first indicator in the districts of Eindhoven. This enables us to visualise the variation between districts.
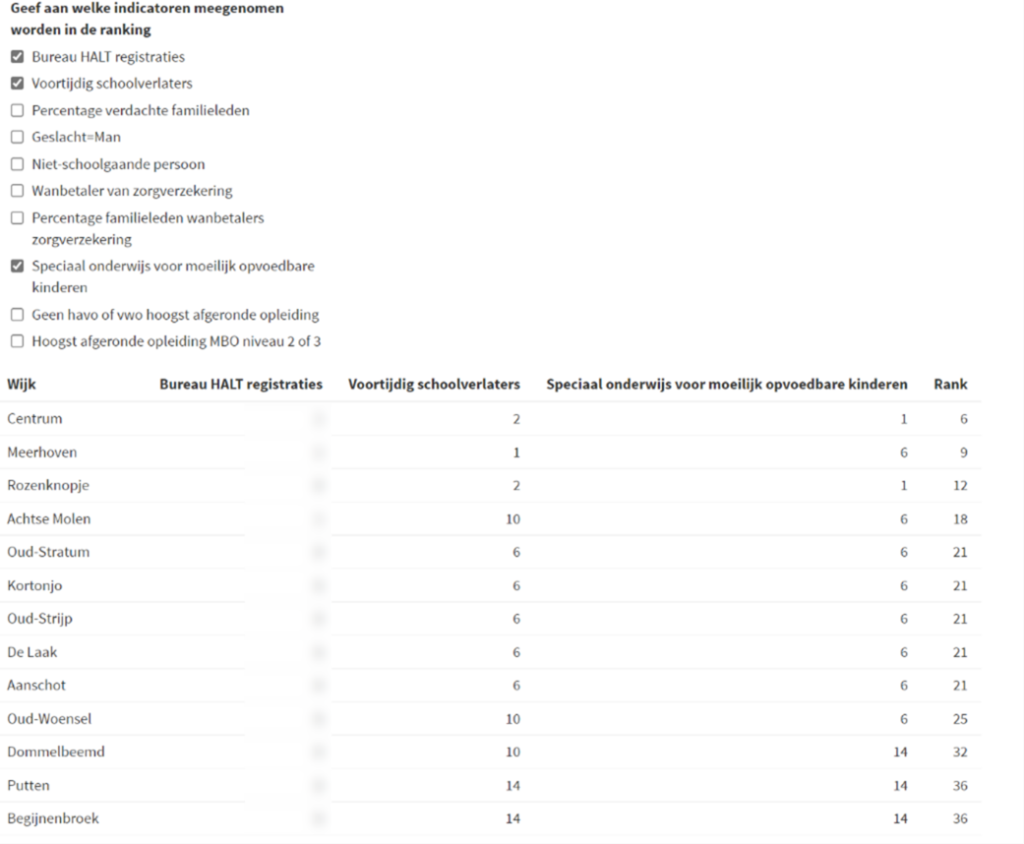
Since comparing multiple indicators per district is also valuable for the city, we have also built that functionality into the dashboard. In the choice menu below, you can select indicators to rank the districts by, enabling comparison between districts.
Underage Suspects
A second essential data source contains information about minors up to 23 years old who have been suspected of a crime. Note that they are only suspects; they have not necessarily been convicted. The datasets we used contain registrations from 2018—2021 and allow us to use the information on the suspects. The registrations are extracted from two different datasets, which include the following registrations:
- The first dataset contains registrations of suspects living in Eindhoven. This includes suspects of a crime committed in Eindhoven or another municipality.
- The second dataset contains registrations of suspects in a crime committed in Eindhoven. This includes suspects living in Eindhoven or elsewhere.
Both datasets contain a group of suspects that live in Eindhoven and are suspects of a crime committed in Eindhoven. The following information is available for each registration:
- Age and gender
- Type of crime
- Municipality and neighbourhood of residence
- Municipality and neighbourhood in which the crime was committed
The dataset also allows us to consider two cases: the unique number of registrations and the unique number of suspects. The following two sections will briefly explain both.
Unique Number of Registrations
Considering the unique number of registrations allows us to get more information on all registrations that have taken place. There can be suspects with multiple registrations. This screen is presented when looking at unique registrations:
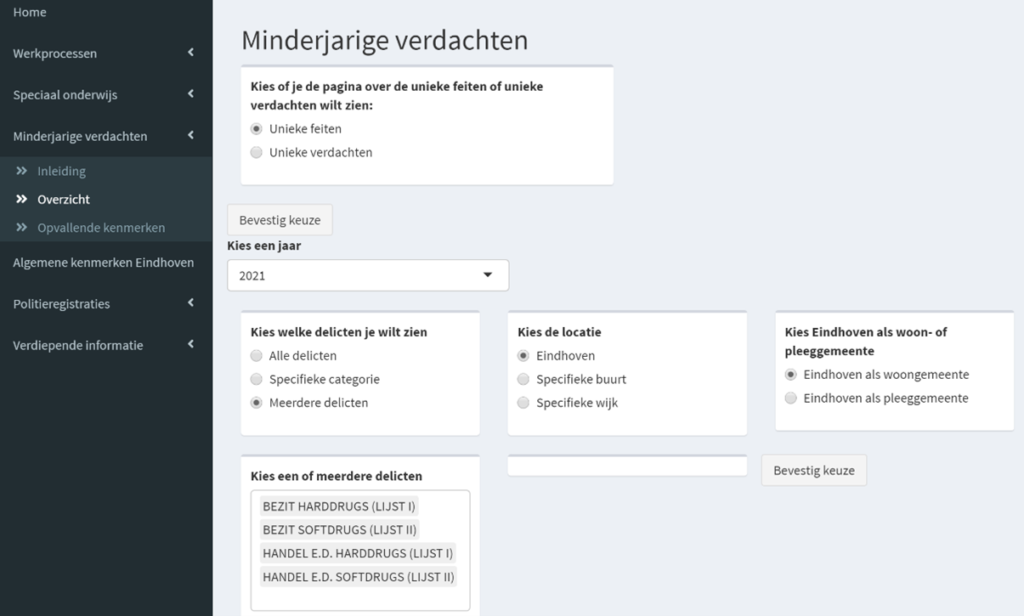
This page allows the user to filter using the following variables:
- Year
- Type of crimes. Either an entire category or more specific crimes.
- Location (specific district/neighbourhood)
- Whether to look at suspects in that location or crimes committed in that location
Using the new filtered dataset, the dashboard will display a page that contains the following information:
First, a bar chart shows the number of registrations over the year. It can also segment registrations using other variables, such as type of crime and location.
Second, multiple maps can be shown. These maps show where most registrations occur or where suspects live. Using a colour scheme, we can easily see where most registrations occur in Eindhoven. This can also be shown for a specific type of crime.
Third, tables show which crime category is most common. In that case, we would look at all crimes together and see the top 10 crimes most often committed per location.
Finally, the age of suspects is displayed using boxplots. These boxplots are illustrated so we can compare registrations with specific conditions to each other. Apart from boxplots, it is also possible to construct line graphs with the percentage of male suspects for different conditions to make additional comparisons.
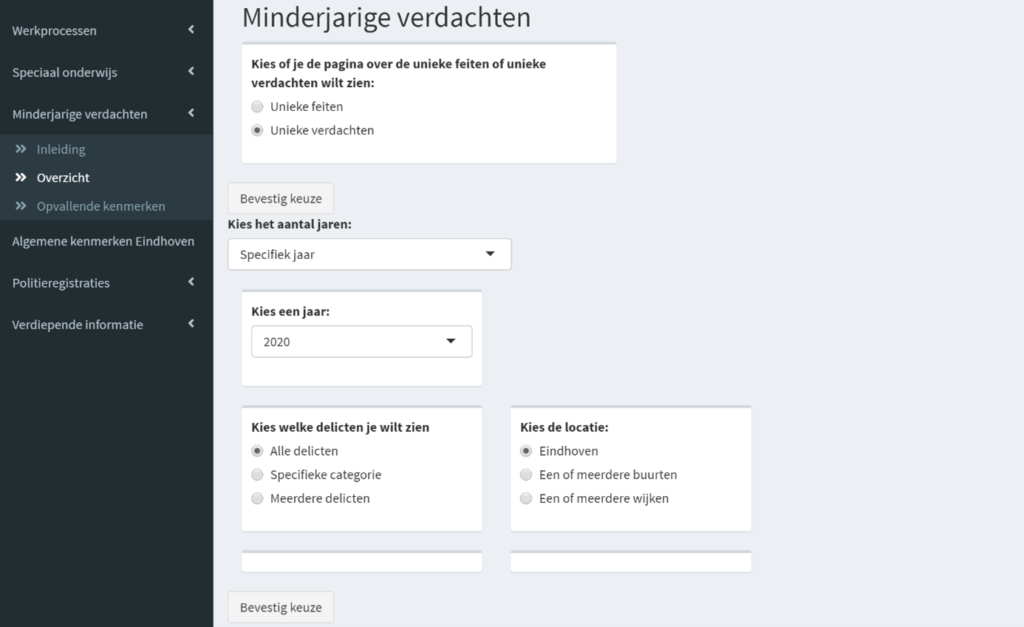
Unique Number of Suspects
If we are interested in the unique number of suspects, we are presented with the following choice menu. Again, we can choose the year for which we want an overview. We can also select the type of crime and location. An additional feature is that we can choose multiple neighbourhoods/districts simultaneously. In this case, we only focus on the unique suspects living in Eindhoven.
This page will output a bar chart again, this time with the number of unique suspects living in Eindhoven. It can also show the number of suspects living in a specific area or involved in a particular type of crime. It will also show the number of unique suspects with a registration that occurs either in or outside Eindhoven. Furthermore, it displays an additional bar chart with the average number of registrations per unique suspect. We can also look at that for specific neighbourhoods/districts.
Moreover, this page also shows maps indicating where most of Eindhoven’s unique suspects live. This is something that was not visible on the previous page. It is also interesting to see this for a specific type of crime and registrations outside of Eindhoven.
Conclusion
The interactive R Shiny dashboard has provided valuable insight into the problem of criminal activity among children in Eindhoven. By analysing data on indicators of potential criminal behaviour and information on minors who have been suspected of crimes, the dashboard has been able to identify patterns and trends in the data. These insights can then be used to inform the development of prevention methods and targeted interventions in specific neighbourhoods.